Independent Study to prepare for workshop
Transcriptomics 1: 👋 Hello data!
3 December, 2025
🎄 Experimental design

Schematic of arabidopsis experiment
🎄 Experimental design
Schematic of arabidopsis experiment
2 plant tissues
2 nickel conditions
6 replicates
2 x 2 x 6 = 24 samples
🎄 Experimental design
Schematic of arabidopsis experiment
2 plant tissues: root and aerial. This is the tissue treatment
2 nickel conditions: control and low Ni. This is the Ni treatment
6 replicates. These are the replicates
2 x 2 x 6 = 24 samples
💉 Experimental design
Schematic of leishmania experiment
💉 Experimental design
Schematic of leishmania experiment
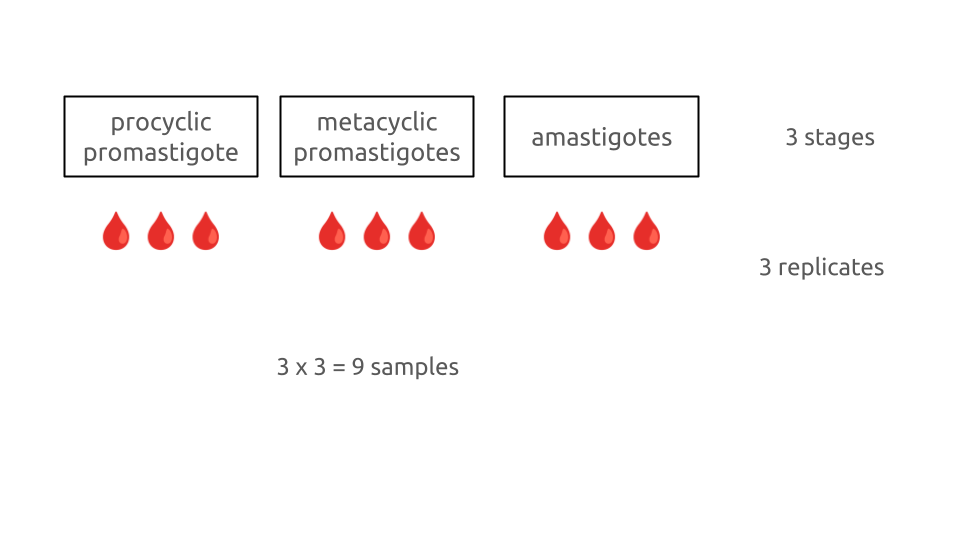
3 stages
3 samples
3 x 3 = 9 samples
💉 Experimental design
Schematic of leishmania experiment
three stages: procyclic promastigotes, metacyclic promastigotes and amastigotes. This is the stage treatment
three samples. These are the replicates
3 x 3 = 9 samples
🐭 Experimental design
Schematic of stem cell experiment
🐭 Experimental design
Schematic of stem cell experiment
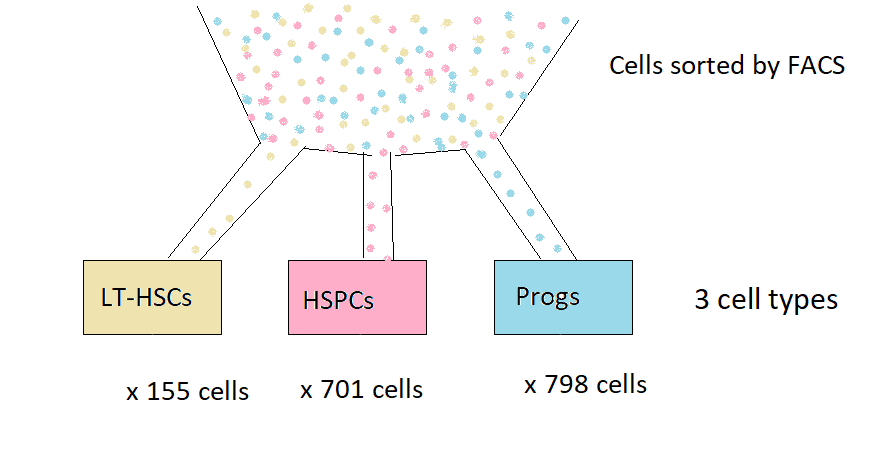
Cells were sorted using flow cytometry on the basis of cell surface markers
There are 3 cell types
Many cells of each cell type were sequenced
🐭 Experimental design
Schematic of stem cell experiment
There are three cell types: LT-HSCs, HSPCs, Progs This is the cell “treatment”
Many cells of each type were sequenced: These are the replicates
155 LT-HSCs, 701 HSPCs, 798 Progs