The difference in mass between subspecies of common chaffinch.
Introduction
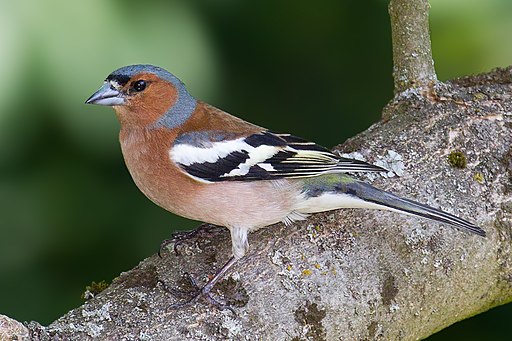
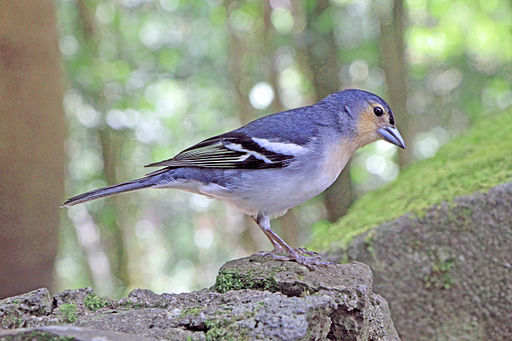
A number of subspecies of the common chaffinch, Fringilla coelebs, have been described based principally on the differences in the pattern and colour of the adult male plumage (Suárez et al. 2009). Two of groups of these subspecies are the “coelebs group” (Figure 1 (a)) that occurs in Europe and Asia and the “canariensis group” (Figure 1 (b)) that occurs on the Canary Islands.
Methods
We randomly sampled 20 F. c. coelebs males and 20 F. c. palmae males and determined their mass with spring scales. Analysis was carried out with R (R Core Team 2025) and tidyverse packages (Wickham et al. 2019) and the manuscript was prepared with Quarto (Allaire et al. 2024). A linear model was fitted to the data to determine if there was a difference in mass between subspecies. Model assumptions were checked visually and with the Shapiro-Wilk test for normality.
Results
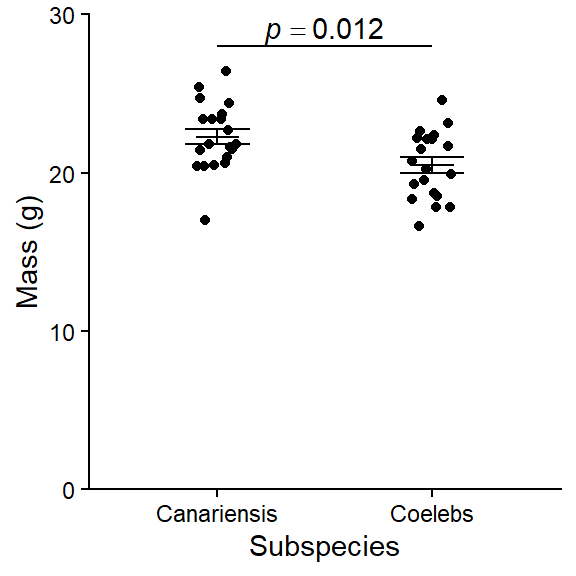
Canariensis chaffinches (\(\bar{x} \pm s.e\): 22.27 \(\pm\) 0.48 g) were significantly heavier than Coelebs (20.48 \(\pm\) 0.48 g; t = 7.01; d.f. = 38; p = 0.01). See Figure 2.
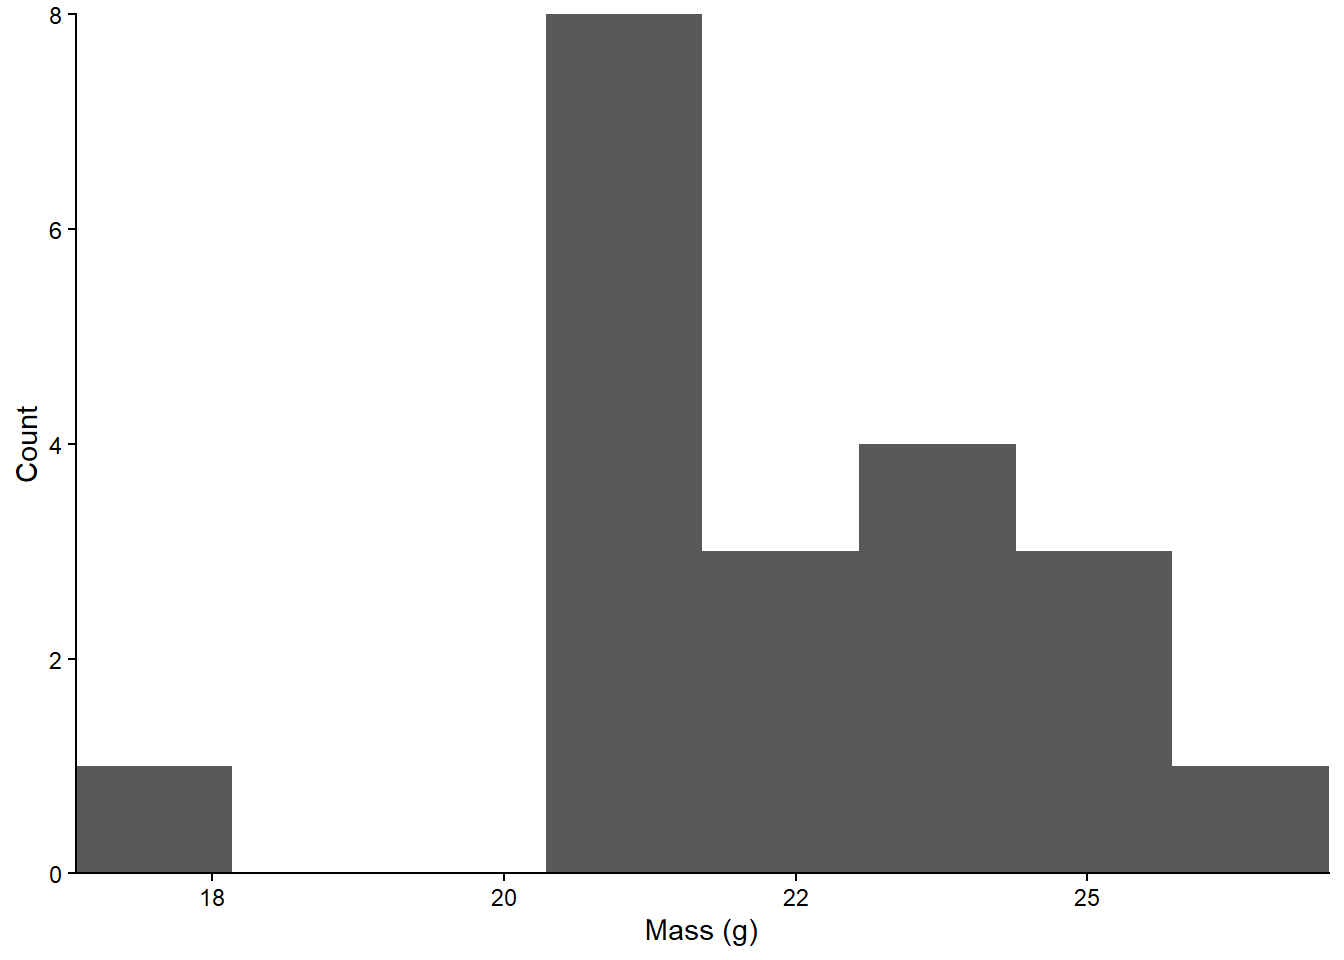
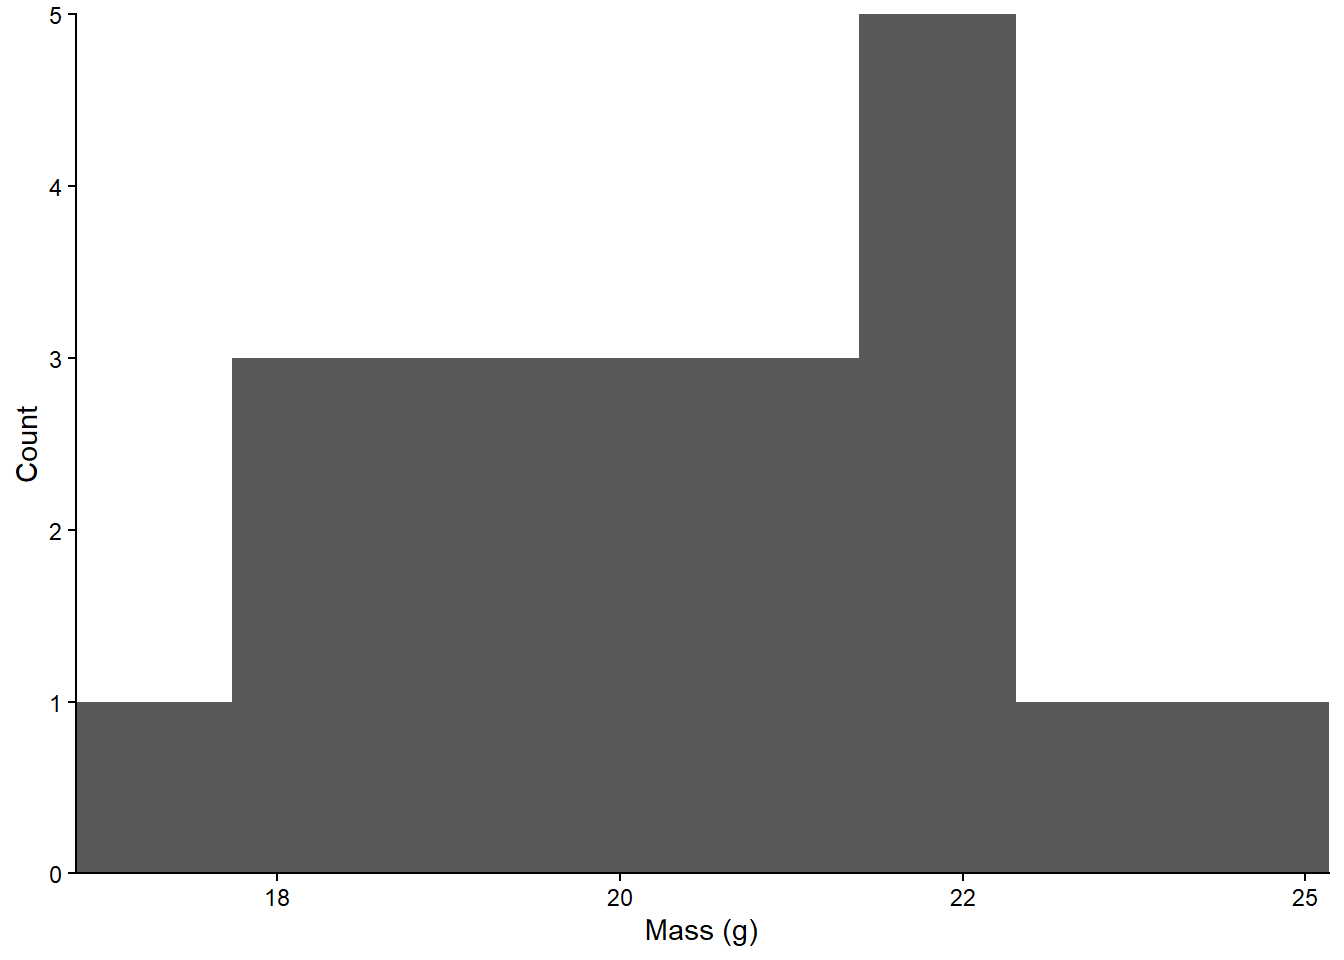
The distribution mass can be can been seen in Figure 3 for Canariensis in Figure 3 (a) and for Coelebs in Figure 3 (b). We don’t really need more figures for this data but it allows you to see how to create multipanel figures.
A summary of the results are gratuitously reproduced in Table 1 just to include a table.
| Subspecies | Mean | Sd | N | Se |
|---|---|---|---|---|
| canariensis | 22 | 2.1 | 20 | 0.48 |
| coelebs | 20 | 2.1 | 20 | 0.48 |
Discussion
yadda yadda
References
Allaire, J. J., Charles Teague, Carlos Scheidegger, Yihui Xie, Christophe Dervieux, and Gordon Woodhull. 2024. Quarto. V. 1.6. Released November. https://doi.org/10.5281/zenodo.5960048.
R Core Team. 2025. R: A Language and Environment for Statistical Computing. R Foundation for Statistical Computing. https://www.R-project.org/.
Suárez, Nicolás M., Eva Betancor, Tilman E. Klassert, Teresa Almeida, Mariano Hernández, and José J. Pestano. 2009. “Phylogeography and Genetic Structure of the Canarian Common Chaffinch (Fringilla Coelebs) Inferred with mtDNA and Microsatellite Loci.” Molecular Phylogenetics and Evolution 53 (2): 556–64. https://doi.org/10.1016/j.ympev.2009.07.018.
Wickham, Hadley, Mara Averick, Jennifer Bryan, et al. 2019. Welcome to the Tidyverse. 4: 1686. https://doi.org/10.21105/joss.01686.