Overview
Types of variable, the normal distribution and summarising data
The type of values our data can take is important in how we analyse and visualise it. This week you will learn the difference between continuous and discrete values and how we summarise and visualise them. You will also learn about the “normal distribution” which is the most important continuous distribution.
Learning objectives
The successful student will be able to:
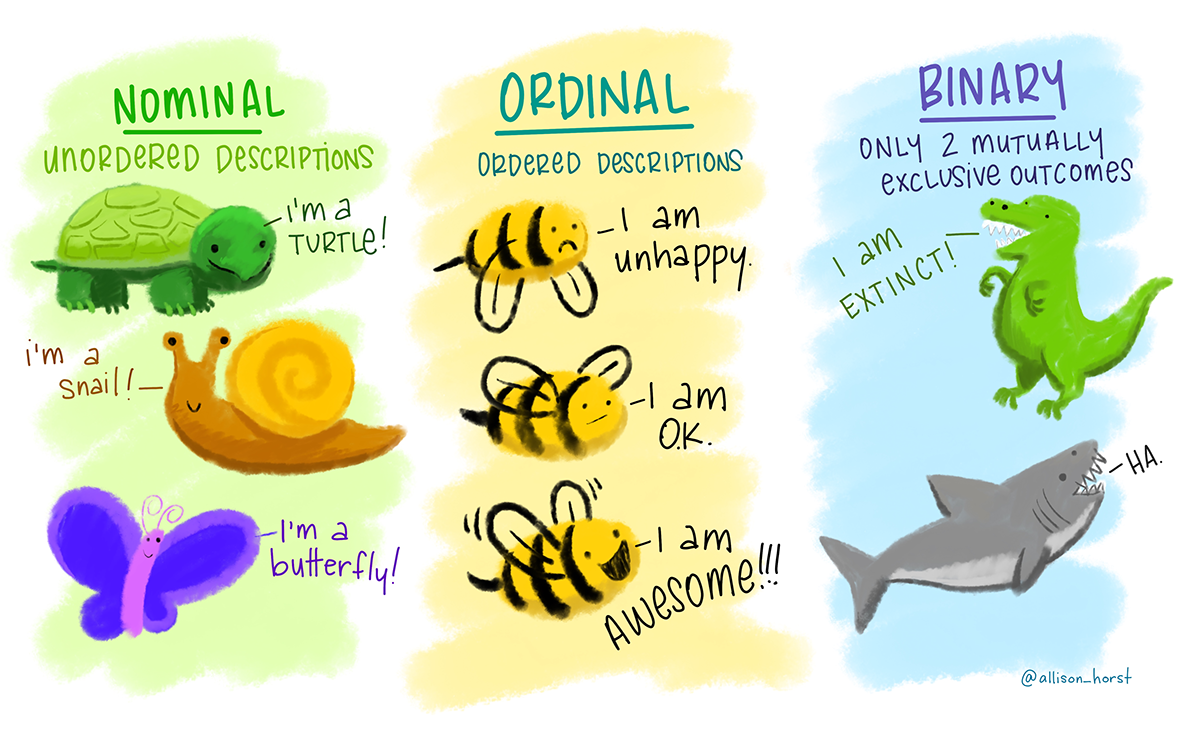
- distinguish between continuous, discrete, nominal and ordinal variable
- read in data in to RStudio from a plain text file and Excel files
- summarise and plot variables appropriately for the data type
Instructions
-
- 📖 Read: Ideas about data
-
💻 Importing data
💻 Summarising discrete data
💻 Summarising count data
💻 Summarising continuous data
-
💻 Summarise some data
💻 Plot some data
💻 Format a plot (1)
💻 Format a plot (2)
📖 Read Understanding the pipe
|>