Overview
The logic of hypothesis testing and confidence intervals
This week we will cover the logic of consider the logic of hypothesis testing and type 1 and type 2 errors. We will also find out what the sampling distribution of the mean and the standard error are, and how to calculate confidence intervals.
Learning objectives
The successful student will be able to:
demonstrate the process of hypothesis testing with an example
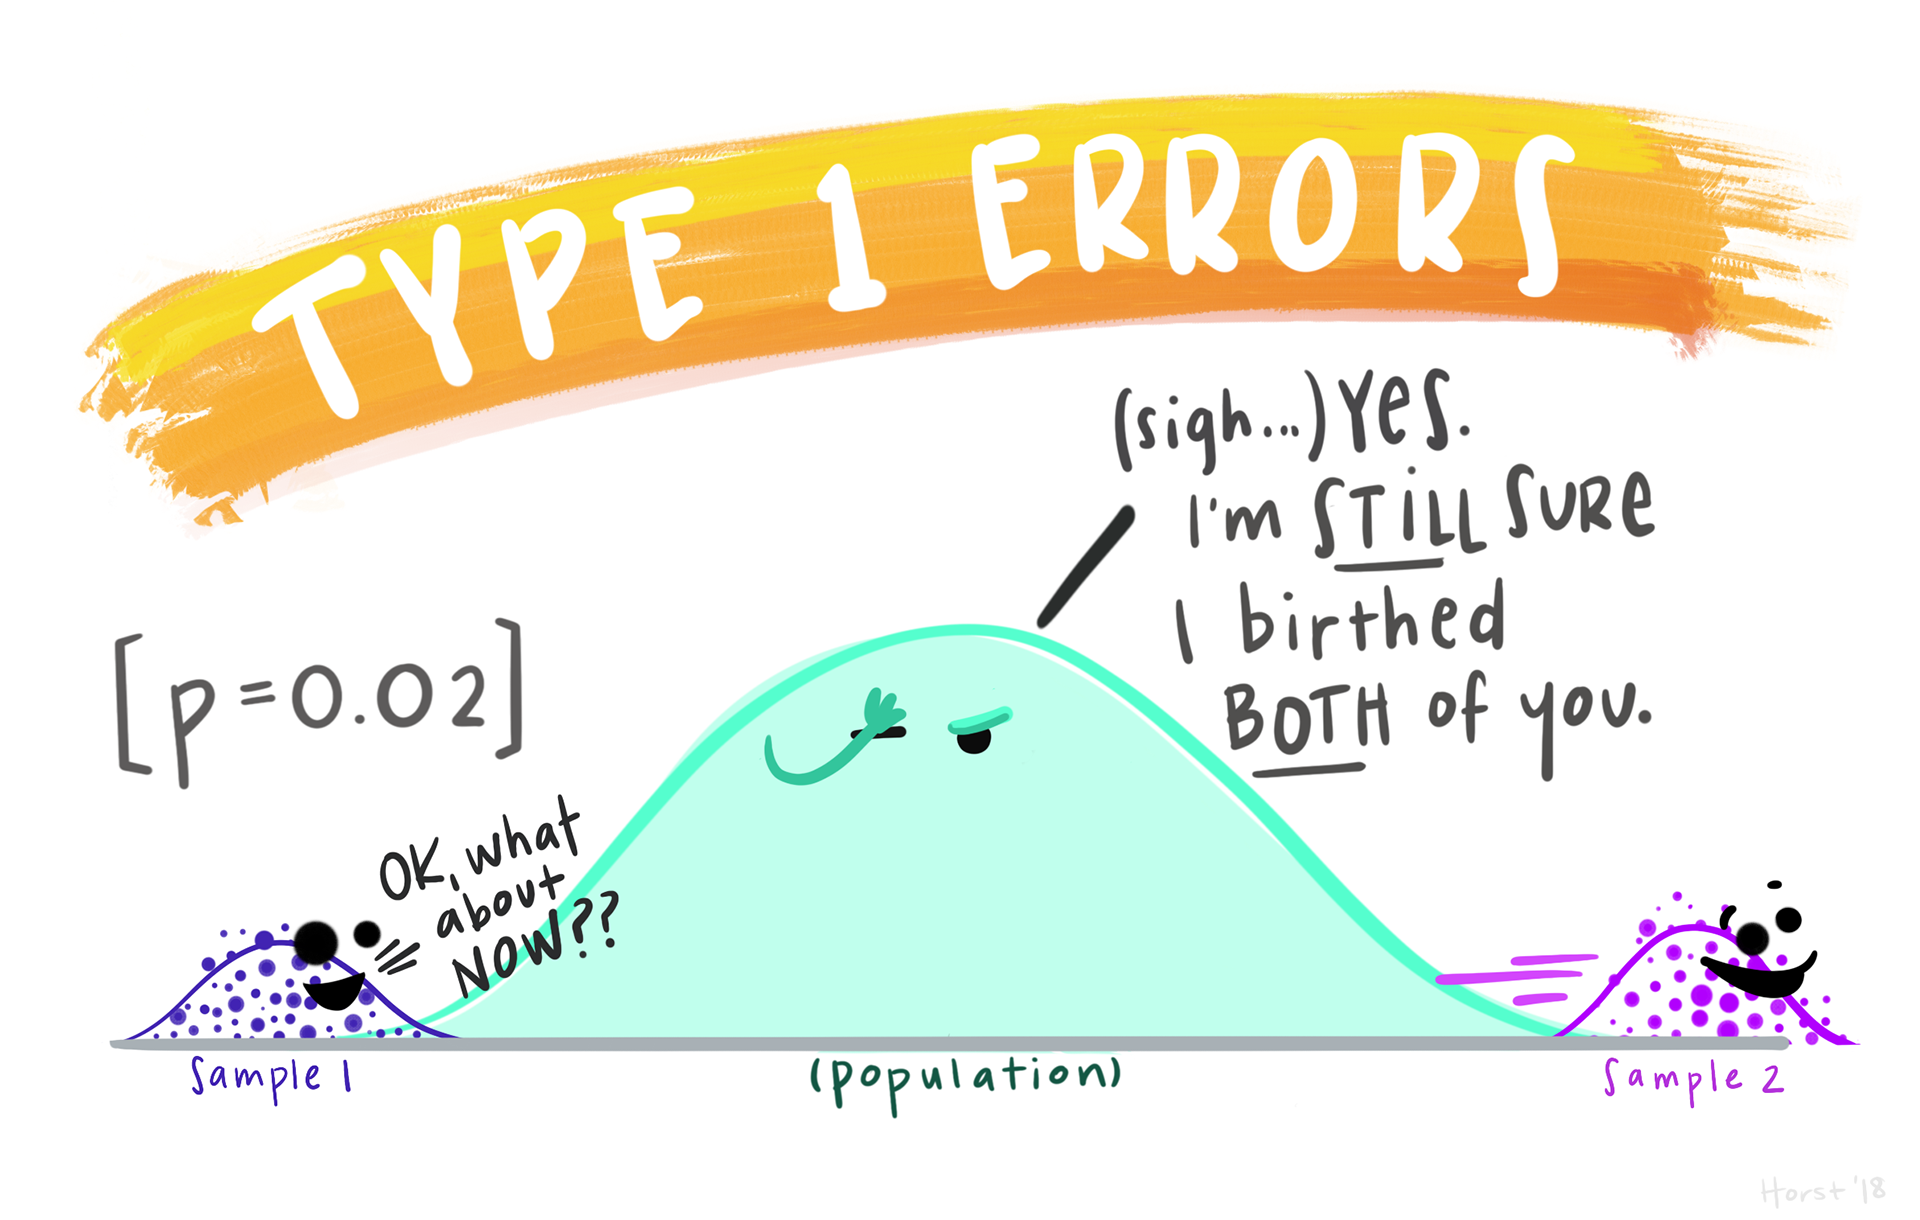
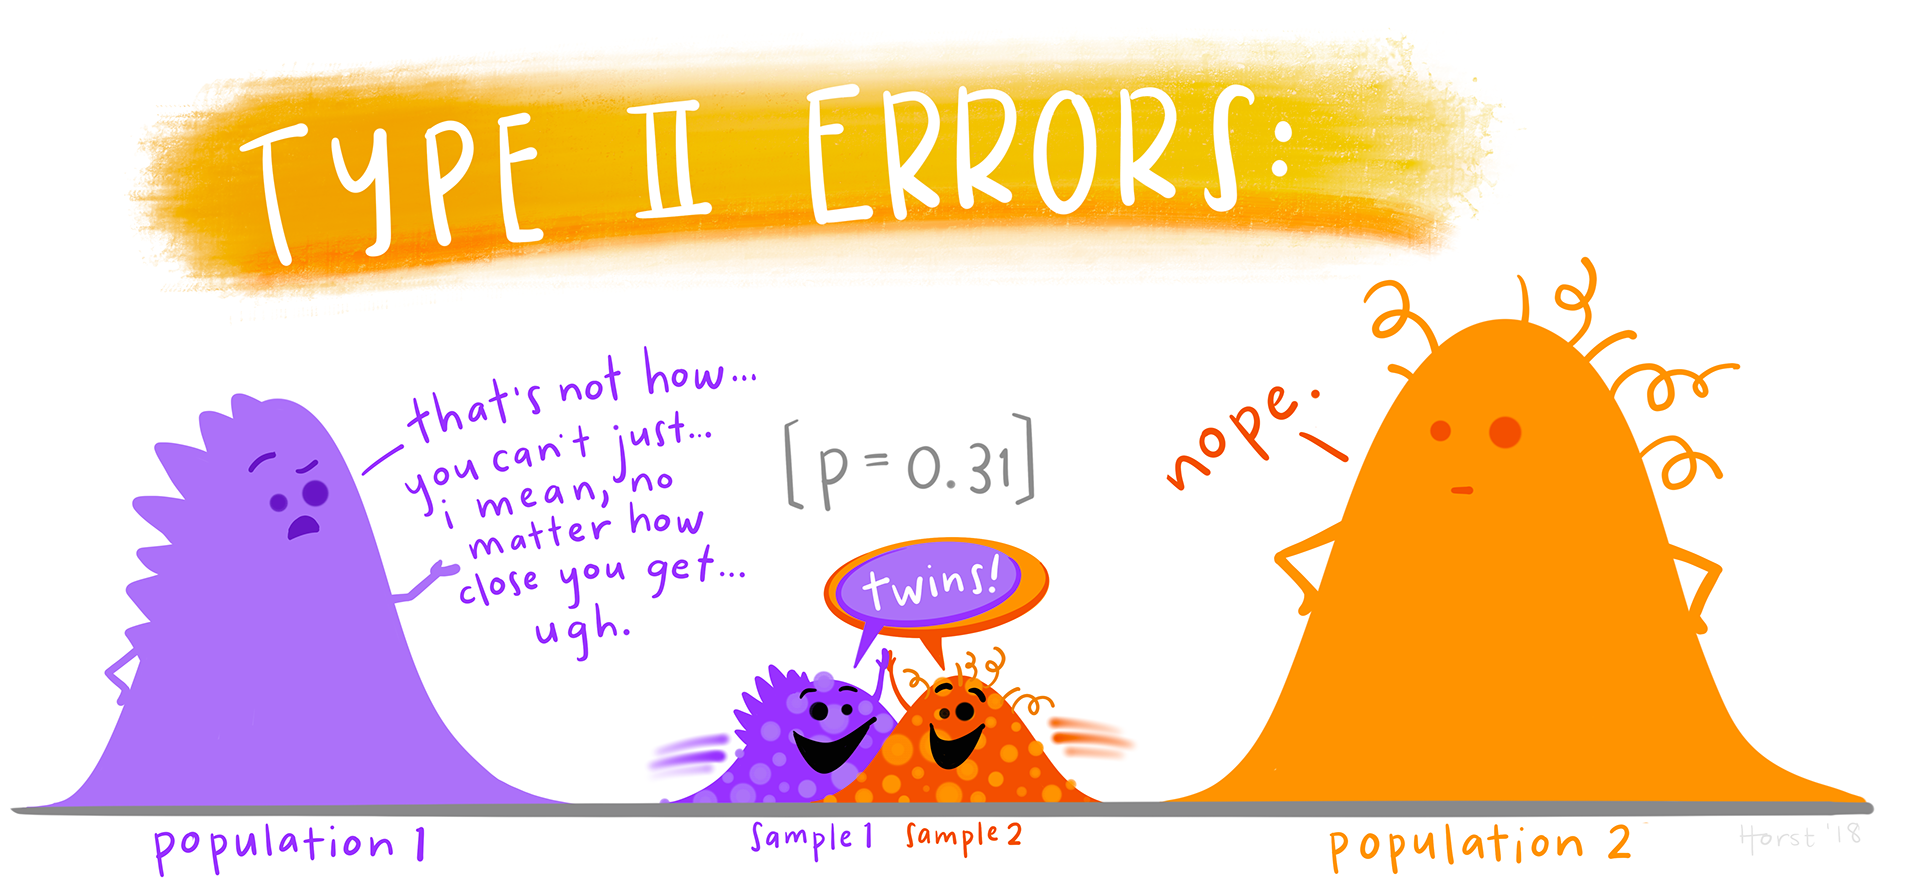
explain type 1 and type 2 errors
define the sampling distribution of the mean and the standard error
explain what a confidence interval is
calculate confidence intervals for large and small samples
Instructions
-
- 📖 Read The logic of hyothesis testing
- 📖 Read Confidence Intervals
-
- 💻 Remind yourself how to import files
- 💻 Calculate confidence intervals on large
- 💻 Calculate confidence intervals on small samples.
-
- 💻 Calculate confidence intervals for each group in a data set
References
Horst, Allison. 2023. “Data Science Illustrations.” https://allisonhorst.com/allison-horst.