Independent Study to consolidate this week
Types of variable, the normal distribution and summarising data
Set up
If you have just opened RStudio you will want to load the packages and import the data.
fly_bristles_means <- read_excel("data-raw/bristles-mean.xlsx")
cats <- read_csv("data-raw/cat-coats.csv")
Exercises
- 💻 Summarise the
fly_bristles_meansdataframe by calculating the mean, median, sample size, standard deviation and standard error of themean_countvariable.
- 💻 Create an appropriate plot to show the distribution of
mean_countinfly_bristles_means
Answer - don’t look until you have tried!
ggplot(fly_bristles_means, aes(x = mean_count)) +
geom_histogram(bins = 10)- 💻 Can you format the plot 2. by removing the grey background, giving the bars a black outline and the fill colour of your choice and improving the axis format and labelling? You may want to refer to last week’s workshop.
Answer - don’t look until you have tried!
ggplot(fly_bristles_means, aes(x = mean_count)) +
  geom_histogram(bins = 10,
                 colour = "black",
                 fill = "skyblue") +
  scale_x_continuous(name = "Number of bristles",
                     expand = c(0, 0)) +
  scale_y_continuous(name = "Frequency",
                     expand = c(0, 0),
                     limits = c(0, 35)) +
theme_classic()- 💻 Amend this code to change the order of the bars by the average mass of each coat colour? Changing the order of bars was covered last week. You may also want to practice formatting the graph nicely.
ggplot(cats, aes(x = coat, y = mass)) +
  geom_boxplot()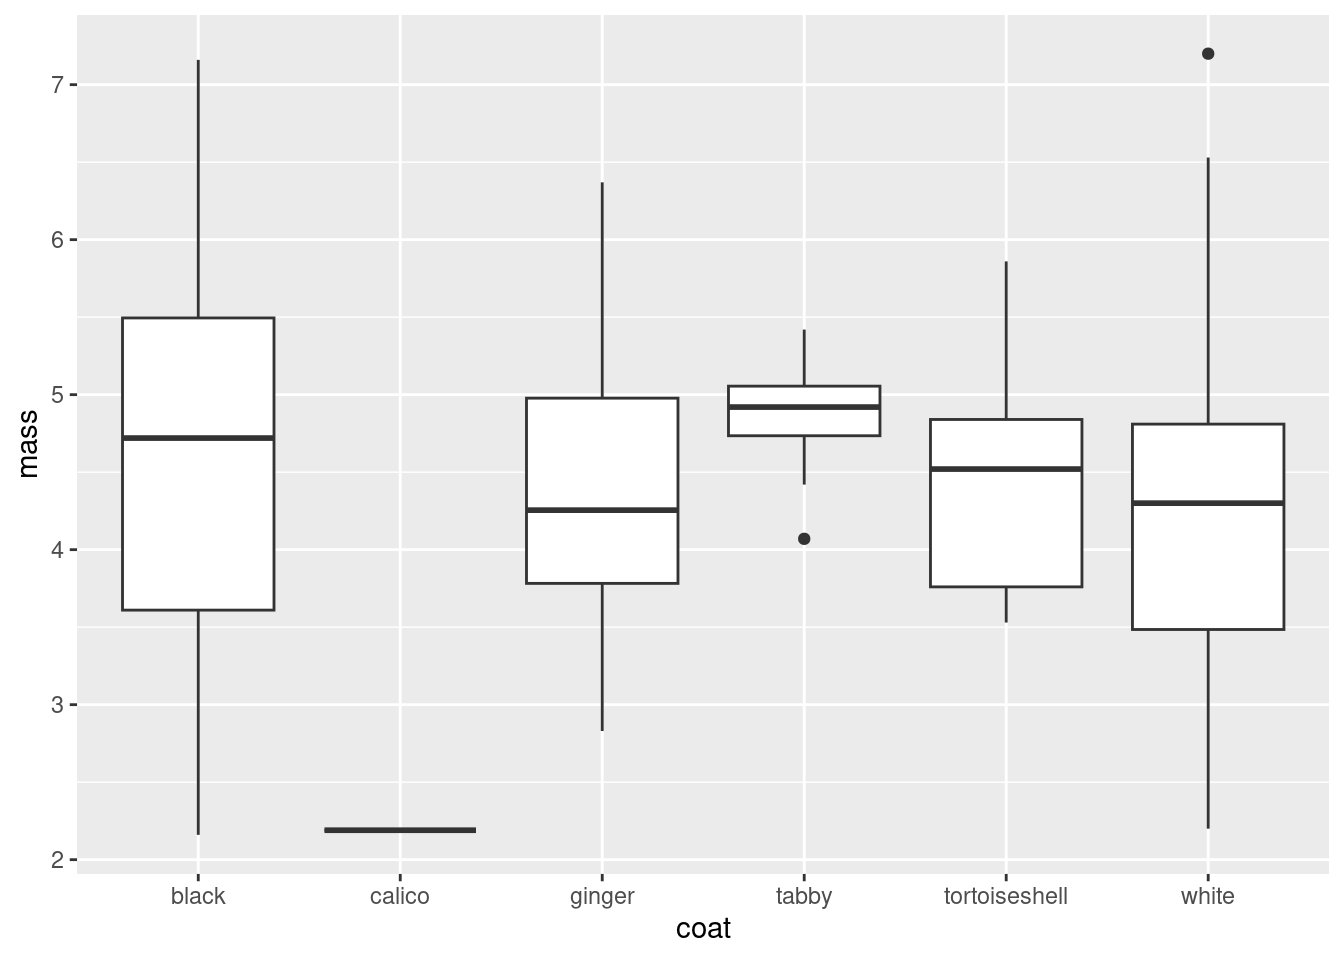
Answer - don’t look until you have tried!
ggplot(cats,
       aes(x = reorder(coat, mass), y = mass)) +
  geom_boxplot(fill = "darkcyan") +
  scale_x_discrete(name = "Coat colour") +
  scale_y_continuous(name = "Mass (kg)",
                     expand = c(0, 0),
                     limits = c(0, 8)) +
theme_classic()- 📖 Read Understanding the pipe
|>