6 About R and RStudio
You are reading a live document. This page is compete but suggestions for improvements are welcome. Follow the link to ‘Make a suggestion’ to suggest improvements.
This chapter starts by explaining what R and RStudio are and how you can install them on your own machine. We introduce you to working in RStudio, changing its appearance to suit you and to the key things you need to know about R.
6.1 What are R and Rstudio?
6.1.1 What is R?
R is a programming language and environment for statistical computing and graphics which is free and open source. It is widely used in industry and academia. It is what is known as a “domain-specific” language meaning that it is designed especially for doing data analysis and visualisation rather than a “general-purpose” programming language like Python and C++. It makes doing the sorts of things that bioscientists do a bit easier than in a general purpose-language.
6.1.2 What is RStudio?
RStudio is what is known as an “integrated development environment” (IDE) for R made by Posit. IDEs have features that make coding a little easier.For example, syntax highlighting, code completion and viewers for files, code objects, packages and plots. You don’t have to use RStudio to use R but it is very helpful.
6.1.3 Why is it better to use R than a spreadsheet program?
Spreadsheet programs like Excel or googlesheets can be very useful for recording and organising data but they are not statistical packages so although you can carry out some analysis tasks in them they are limited, get things wrong (known about since 1994) and teach you bad data habits. Spreadsheets encourage you to do things that are going to make analysis difficult.
6.2 Installing R and Rstudio
You will need to install both R and RStudio to use them on your own machine. Installation is normally straightforward but you can follow a tutorial.
6.2.1 Installing R
Go to https://cloud.r-project.org/ and download the “Precompiled binary distributions of the base system and contributed packages” appropriate for your machine.
6.2.1.1 For Windows
Click “Download R for Windows”, then “base”, then “Download R 4.#.# for Windows”. This will download an .exe file. Once downloaded, open (double click) that file to start the installation.
6.2.1.2 For Mac
Click “Download R for (Mac) OS X”, then “R-4.#.#.pkg” to download the installer. Run the installer to complete installation.
6.2.1.3 For Linux
Click “Download R for Linux”. Instructions on installing are given for Debian, Redhat, Suse and Ubuntu distributions. Where there is a choice, install both r-base and r-base-dev.
6.2.2 Installing R Studio
Go to https://posit.co/download/rstudio-desktop/ and download RStudio Desktop for your operating system.
6.3 Packages
A R package is a collection of R functions which are related to a particular task or set of tasks. When you install R, it comes with a set of packages known as the base packages. These are stats, graphics, grDevices, utils, datasets, methods and base. You can a lot done with these packages! However there are many other packages that allow you extend the functionality of R to do all manner of specialised tasks in bioinformatics, spatial analysis, audio/image analysis and almost anything else you can think of. These packages are written by the R community and are available for free – this is one of the strengths of an open source language like R.
To use a package that is not one of the base packages you need to install it from a package repository. The are two main repositories for R packages:
CRAN (Comprehensive R Archive Network) is the official and default repository for R packages. You can install packages from CRAN using the
install.packages()function in R. There is also a menu option in RStudio to install packages from CRAN.Bioconductor is a repository specifically for bioinformatics packages. You can install packages from Bioconductor using the
BiocManager::install()function in R.
You can also install packages from other sources, such as GitHub. Github is a popular platform for hosting code, often including the latest versions of packages that have not yet been submitted to CRAN. Many developers release experimental or in-progress packages on GitHub with the newest features.
In the next chapter you will install your first package, the tidyverse (Wickham et al. 2019), which is a collection of packages that are designed to work together to make data analysis easier and more intuitive.
6.4 Introduction to RStudio
In this section we will introduce you to working in RStudio. We will explain the windows that you see when you first open RStudio and how to change its appearance to suit you.
6.4.1 Changing the appearance
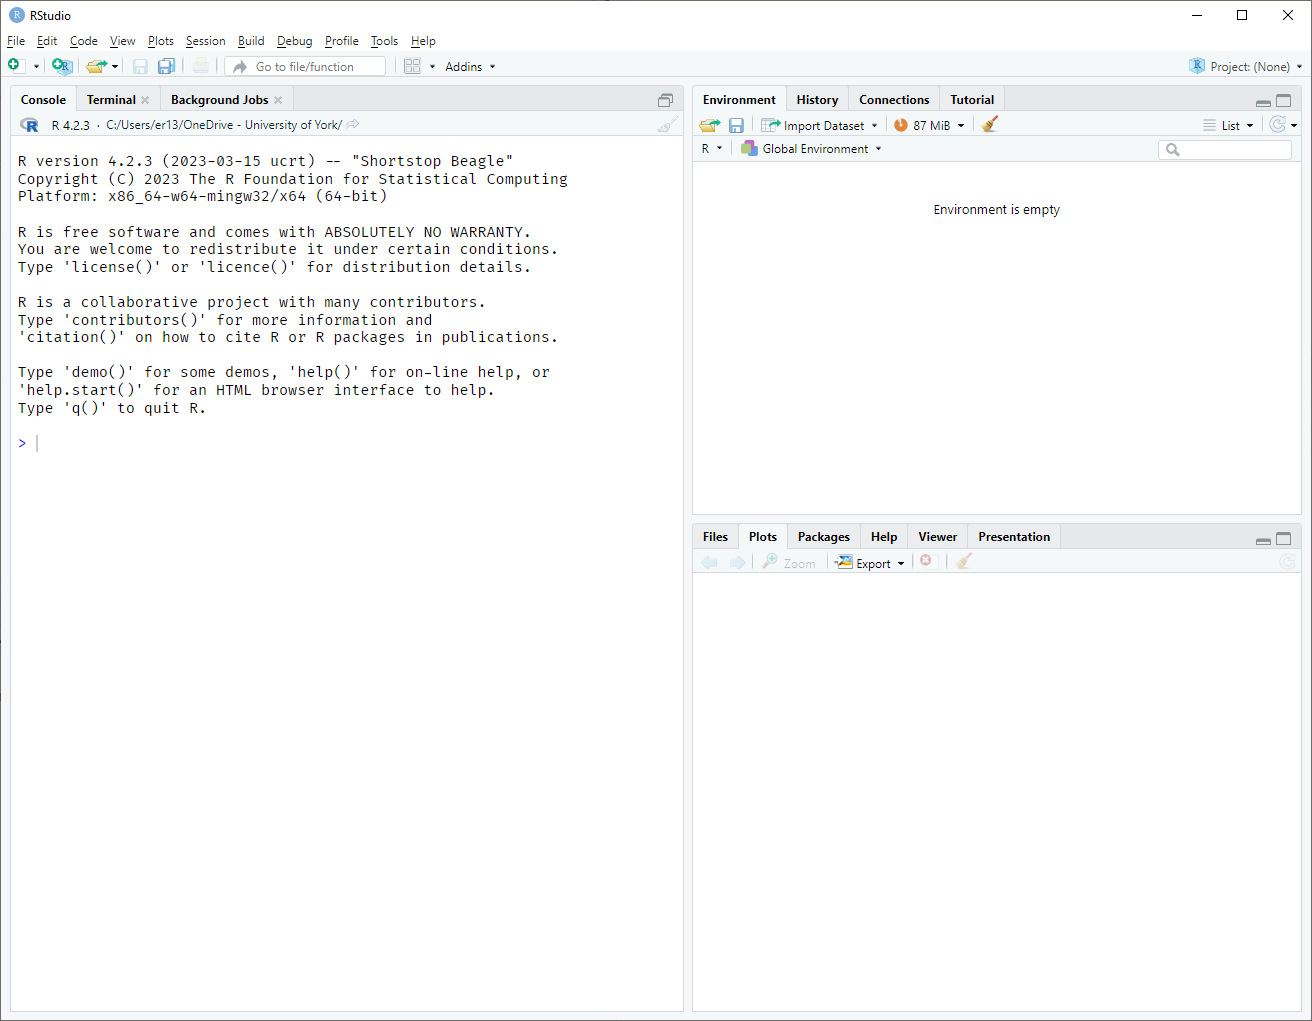
When you first open RStudio it will display three panes and have a white background Figure 6.1
We will talk more about these three panes soon but first, let’s get into character - the character of a programmer! You might have noticed that people comfortable around computers are often using dark backgrounds. A dark background reduces eye strain and often makes “code syntax” more obvious making it faster to learn and understand at a glance. Code syntax is the set of rules that define what the various combinations of symbols mean. It takes time to learn these rules and you will learn best by repeated exposure to writing, reading and copying code. You have done this before when you learned your first spoken language. All languages have syntax rules governing the order of words and we rarely think about these consciously, instead relying on what sounds and looks right. And what sounds and looks right grows out repeated exposure. For example, 35% of languages, including English, Chinese, Yoruba and Polish use the Subject-Verb-Object syntax rule:
- English: Emma likes R
- Chinese: 艾玛喜欢R Emma xǐhuān R
- Yoruba: Emma fẹran R
- Polish: Emma lubi R
and 40% use Subject-Object-Verb including Turkish and Korean
- Turkish: Emma R’yi seviyor
- Korean: 엠마는 R을 좋아한다 emmaneun Reul joh-ahanda
You learned this rule in your language very early, long before you were conscious of it, just by being exposed to it frequently. In this book I try to tell you the syntax rules, but you will learn most from looking at, and copying code. Because of this, it is well worth tinkering with the appearance of RStudio to see what Editor theme makes code elements most obvious to you.
There is a tool bar at the top of RStudio. Choose the Tools option and then Global options. This will open a window where many options can be changed Figure 6.2.
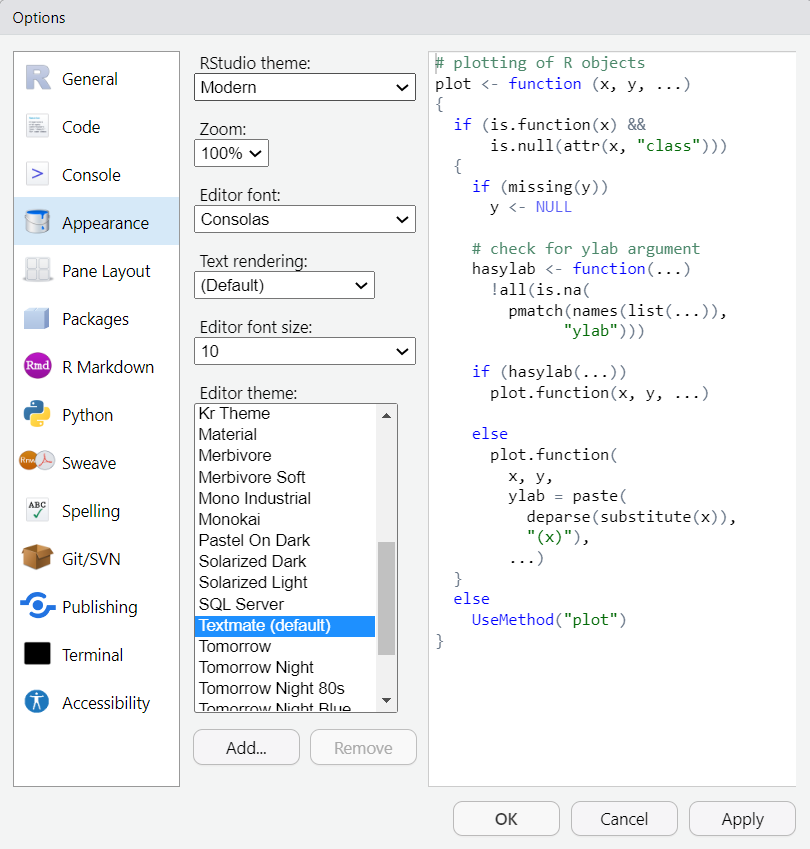
Go to the Appearance Options and choose and Editor theme you like, followed by OK.
The default theme is called Textmate. You will notice that all the Editor themes have syntax highlighting so that keywords, variable names, operators, etc are coloured. Some themes have stronger contrasts than others. For beginners, I recommend Vibrant Ink, Chaos or Merbivore rather than Dreamweaver or Gob which have little contrast between some elements. However, individuals differ so experiment for yourself. I tend to vary between Solarised light and dark.
You can also turn one Screen Reader Support in the Accessibility Options in Tools | Global Options.
Back to the Panes. You should be looking at three windows: One on the left and two on the right1.
The window on the left, labelled Console, is where R commands are executed. In the next chapter we will start by typing commands in this window. Over on the right hand side, at the top, are several tabs, with the Environment tab showing. This is where all the objects and data that you create will be listed. Behind the Environment tab is the History tab and later you will be able to view this to see a history of all your commands.
On the bottom right hand side, we have a Plots tab, which is where your plots will go, a Files tab which is a file explorer just like Windows Explorer or Mac Finder, and a Packages tab where you can see all the packages that are installed. The Packages tab also provides a way to install additional packages. The Help tab has access to all the manual pages.
6.5 Summary
R is a free, open-source programming language for statistical computing and graphics. RStudio is an integrated development environment (IDE) that provides a user-friendly interface for working with R, offering features like syntax highlighting, auto-completion, and plot viewers.
R enables reproducible, script-based data analysis—more robust and flexible than spreadsheets or menu-driven tools like SPSS. It is especially well-suited for scientific research and has wide adoption in academia and industry.
R is installed from CRAN, and RStudio is installed from Posit. The process varies slightly for Windows, macOS, and Linux users.
R’s capabilities are extended by packages—collections of functions for specific tasks. Packages can be installed from CRAN, Bioconductor (for bioinformatics), or GitHub. The
install.packages()andBiocManager::install()functions are commonly used.RStudio includes panes for the Console, Environment, Files, Plots, Packages, and Help. Users can customize the interface (e.g., themes for better syntax visibility). Learning R syntax comes best from repetition and experimentation.
If this is not a fresh install of RStudio, you might be looking at fours windows, two on the left and two on the right. That’s fine - we will all be using four shortly. For the time being, you might want to close the “Script” window using the small cross next to “Untitled1”.↩︎